Infographics have transformed the way we teach and learn, especially in the dynamic field of science education. By combining visuals with information, these engaging tools have the power to captivate students’ attention while enhancing their understanding of complex concepts. Read on to discover how to effectively use infographics in an interactive science classroom.
The Role of Infographics in Science Education
Integrating infographics into science education allows educators to present intricate data and relationships in a more digestible format. Students often struggle with traditional teaching methods that rely heavily on text, but infographics can simplify the delivery of content, making it more relatable. Utilizing visual elements fosters an inviting atmosphere in the classroom, where students feel encouraged to explore and inquire.
Significance in Engaging Learners
In the realm of interactive science education, infographics serve as crucial tools for engagement. They not only stimulate visual learning but also promote critical thinking by encouraging students to analyze information rather than passively consume it. This approach creates a more active learning environment, wherein learners are more likely to retain information and comprehend complex science topics.
Optimal Usage in the Classroom
Implementing infographics during key phases of a lesson can maximize their impact. For instance, they can introduce new concepts, summarize critical points, or serve as reference material during experiments. Additionally, utilizing infographics during group projects fosters collaboration among students, encouraging them to express their findings creatively while solidifying their learning through peer discussions.
Advantages for Educators and Learners
Utilizing infographics in interactive science education not only enhances student engagement but also aids educators in delivering content more effectively. Educators can save time during lesson planning by incorporating pre-designed infographic templates. Moreover, these visuals can be easily shared across digital platforms, allowing access to a broader audience beyond the classroom.
Frequently Asked Questions
1. How do infographics improve information retention?
Infographics improve retention by presenting data visually, which can be easier for students to remember compared to text-heavy resources.
2. Can infographics be used for all science topics?
Yes, infographics are versatile and can be adapted to cover a wide range of science topics, from biology to physics.
3. Are there specific design guidelines for creating effective infographics?
Effective infographics should be clear, succinct, visually appealing, and focused on the key messages to ensure they hold the audience’s attention.
4. What tools can be used to create infographics?
There are various tools available for creating infographics including Canva, Piktochart, and Venngage, which offer user-friendly templates.
Best Practices for Using Infographics in Interactive Science Education
The target of utilizing infographics in interactive science education is to enhance comprehension and promote engagement among students. Personally, I’ve witnessed remarkable outcomes when integrating infographics into my lessons. For instance, while teaching the concept of photosynthesis, I used an infographic to visually represent the process. Including elements such as diagrams and color-coded steps not only made the information clearer but also generated discussions among students about the importance of each component, such as sunlight and chlorophyll. By incorporating visuals, I was able to facilitate deeper discussions and help students connect the dots between theoretical knowledge and real-world applications.
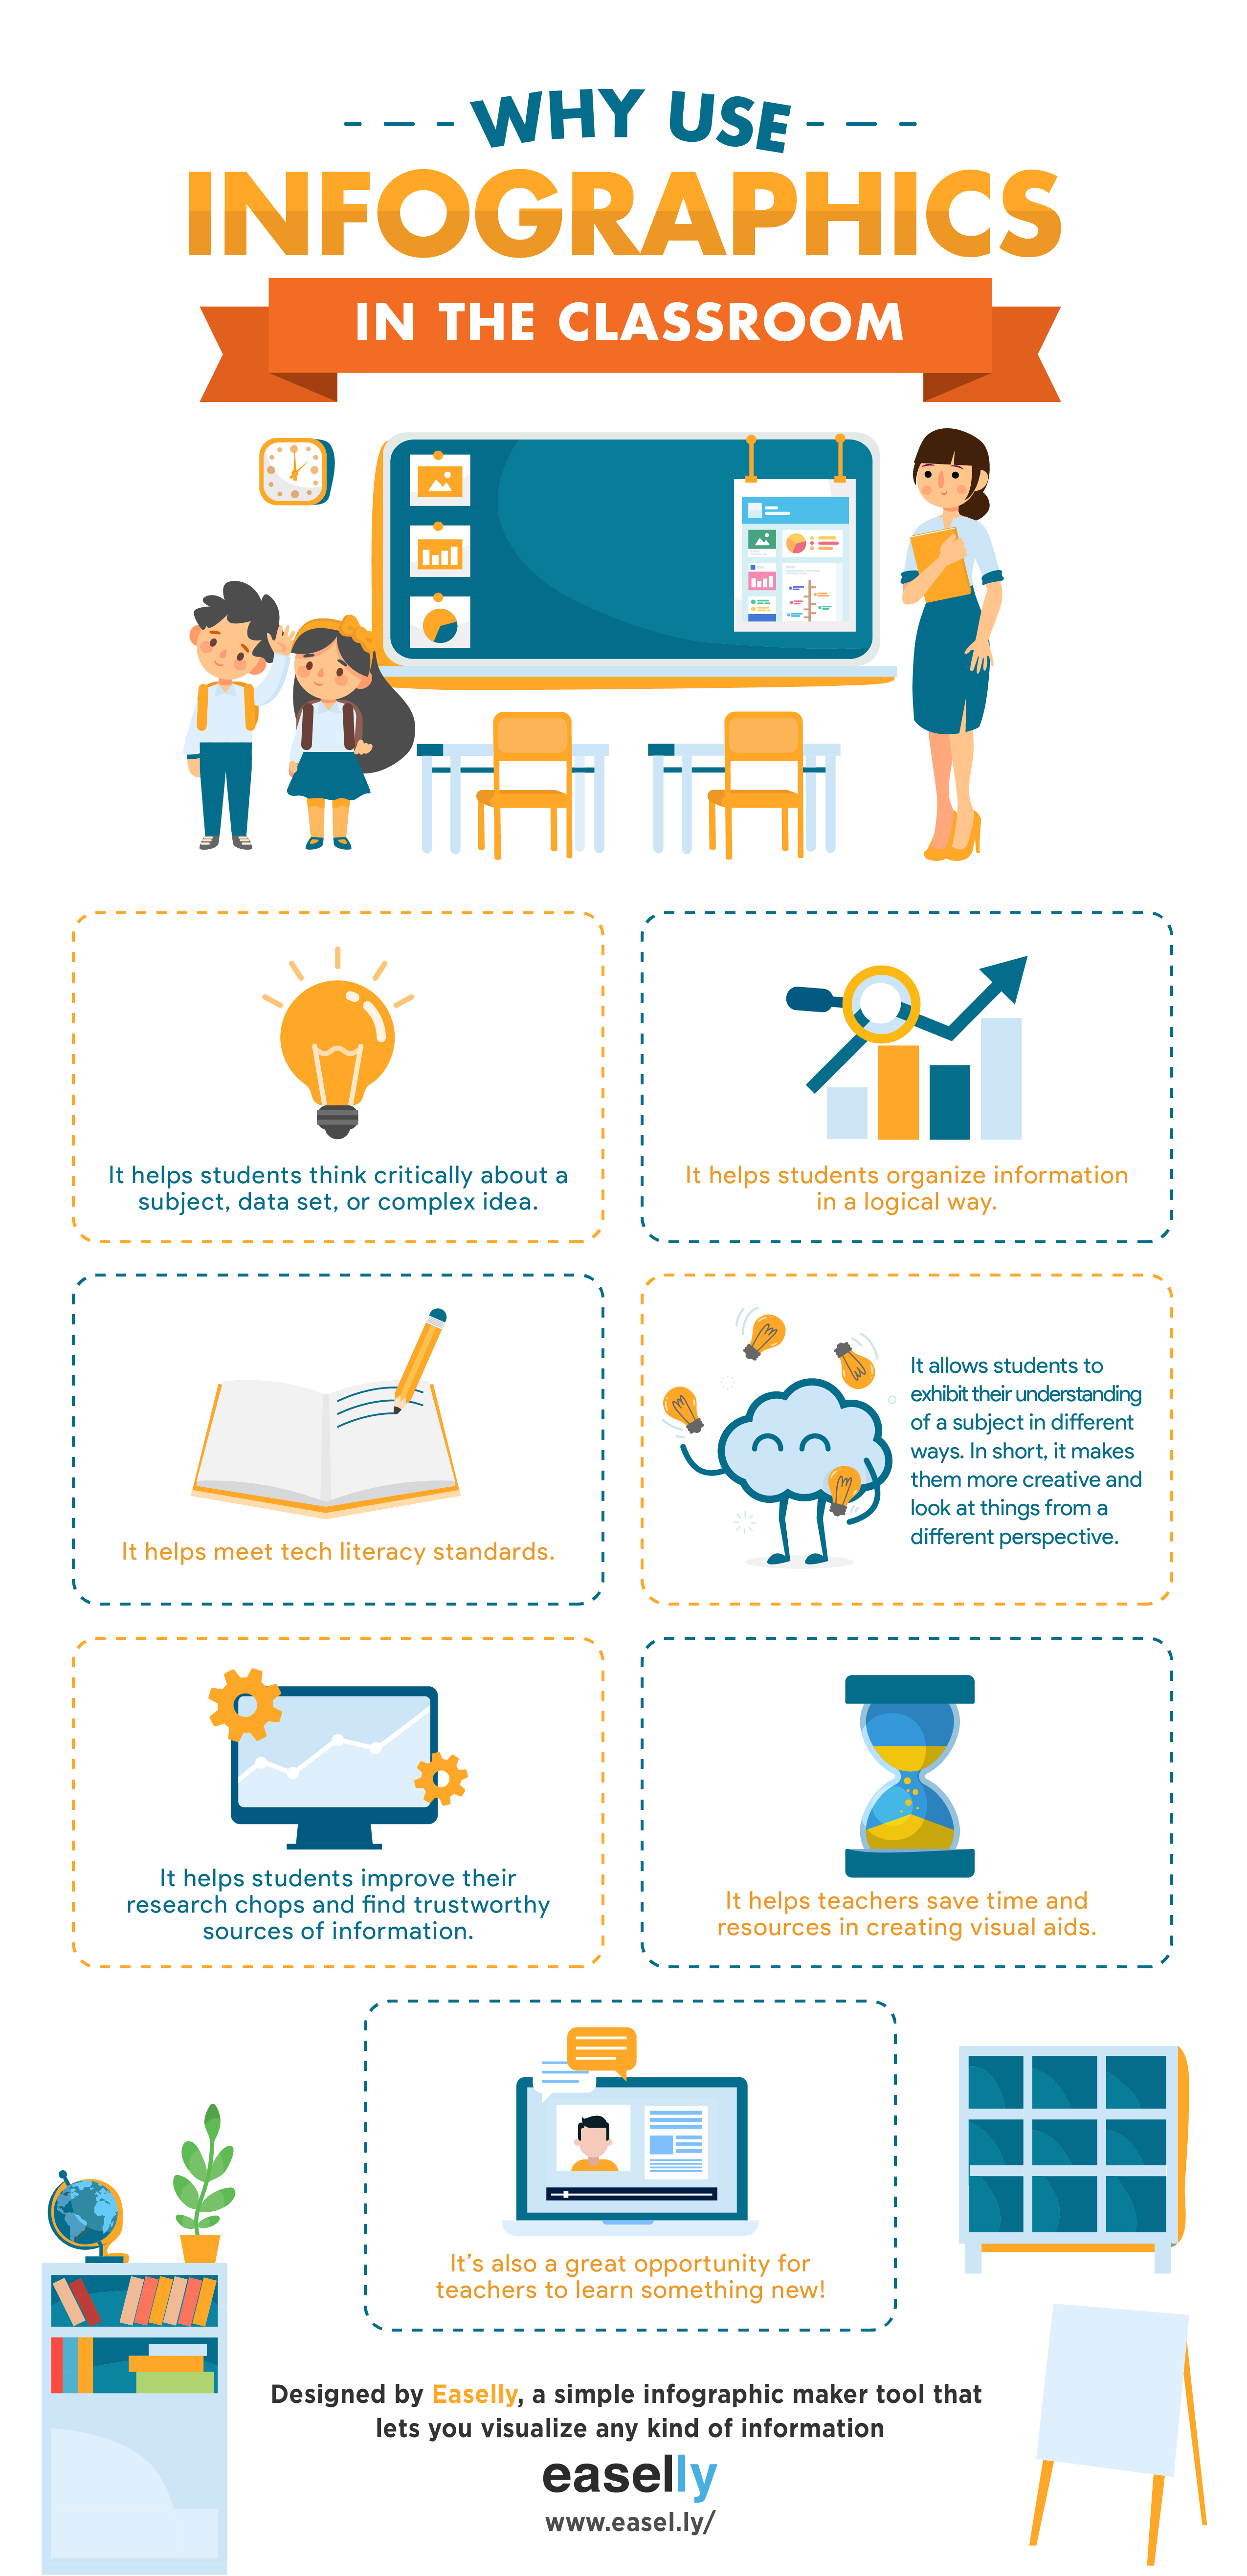
Through this experience, I learned firsthand that the use of infographics in interactive science education not only clarifies content but also ignites excitement among students, promoting a more robust understanding of scientific principles.
Insights on Best Practices for Using Infographics in Interactive Science Education
By embracing these strategies, educators can significantly elevate the learning experience in their classrooms. Utilizing well-designed infographics creates a bridge between detailed scientific concepts and interactive learning.
If you are searching about People who understand science and technology are smarter, more you’ve came to the right page. We have 10 Images about People who understand science and technology are smarter, more like Infographic Explaining Infographics, Infographic Technology Timeline and also Research, Bio Technology And Science Infographic Stock Vector. Here you go:
People Who Understand Science And Technology Are Smarter, More

www.pinterest.com
infographic understand smarter competitive
Scientific Report Infographic Template – Venngage

venngage.com
biology
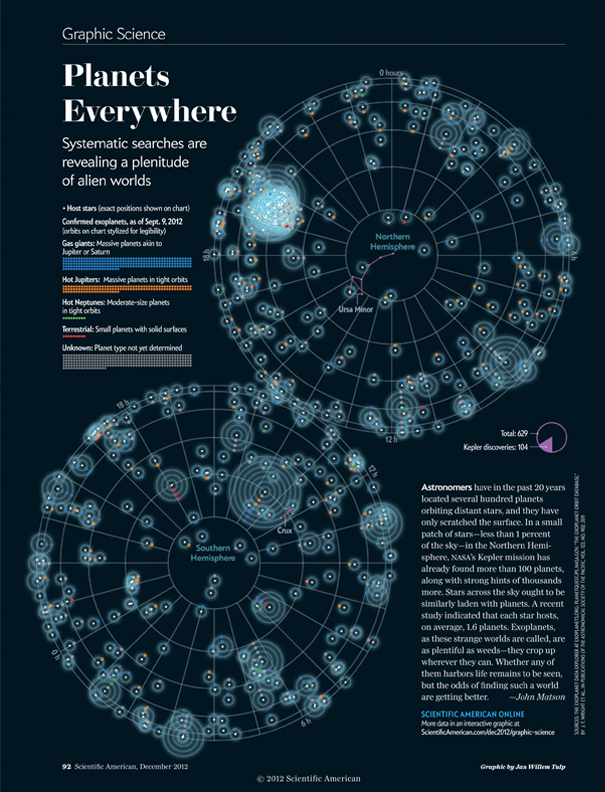
Scientific Infographic: How Cool Are They? – Mind The Graph Blog
mindthegraph.com
Infographic Technology Timeline

ar.inspiredpencil.com
Infographic Resources – OnePointe Solutions

www.onepointesolutions.com
infographic onepointesolutions
Infographic Explaining Infographics

ar.inspiredpencil.com
Transforming Science Education Infographic – E-Learning Infographics

elearninginfographics.com
transforming infographics elearninginfographics infograph salary smarter competitive productive scoop infographicnow источник
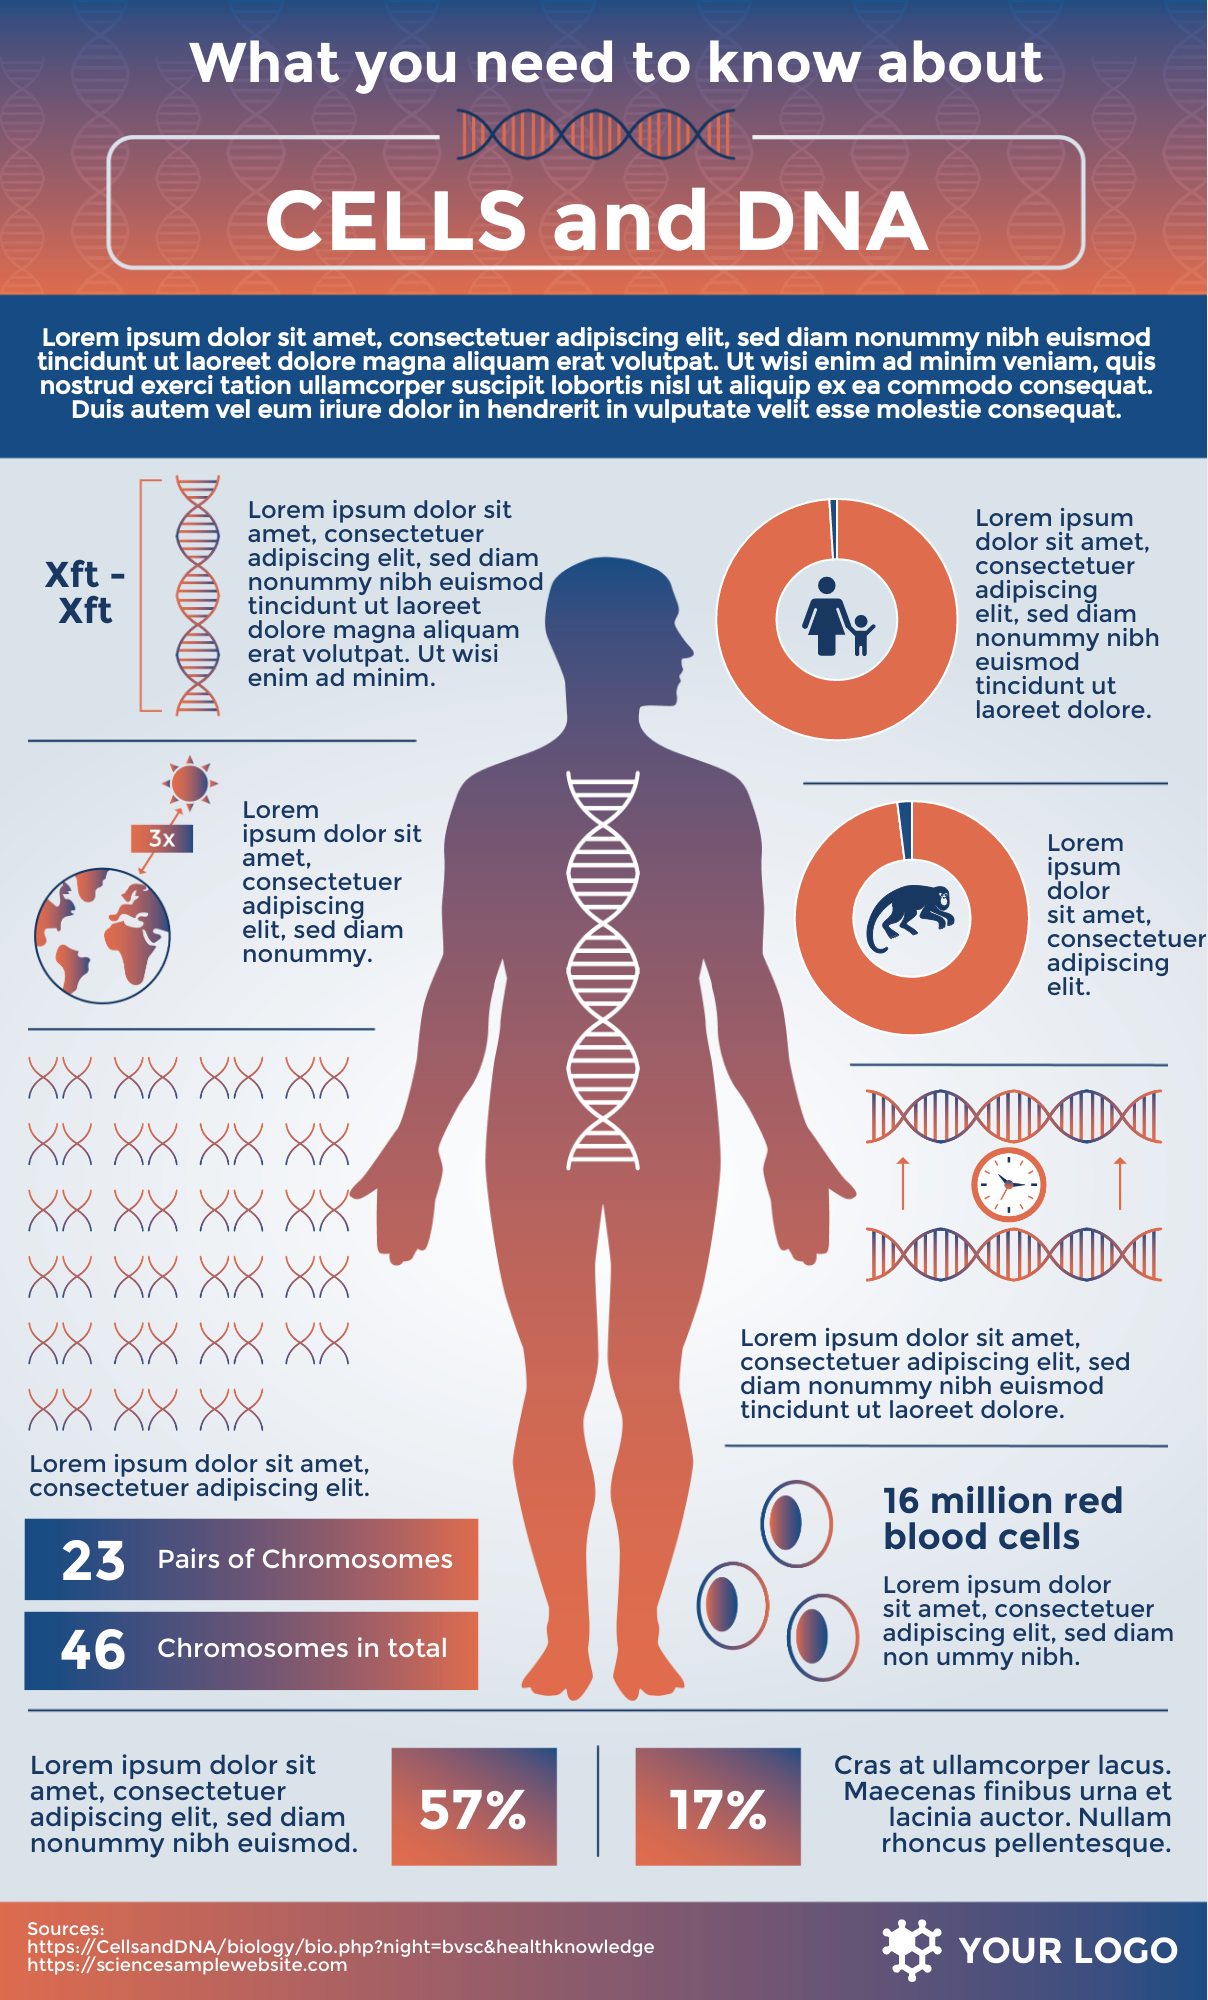
DNA Infographic Template – Simple Infographic Maker Tool By Easelly
www.easel.ly
infographic infographics simplify
Research, Bio Technology And Science Infographic Stock Vector

www.pinterest.com
Climate Change Infographic – Zilladop
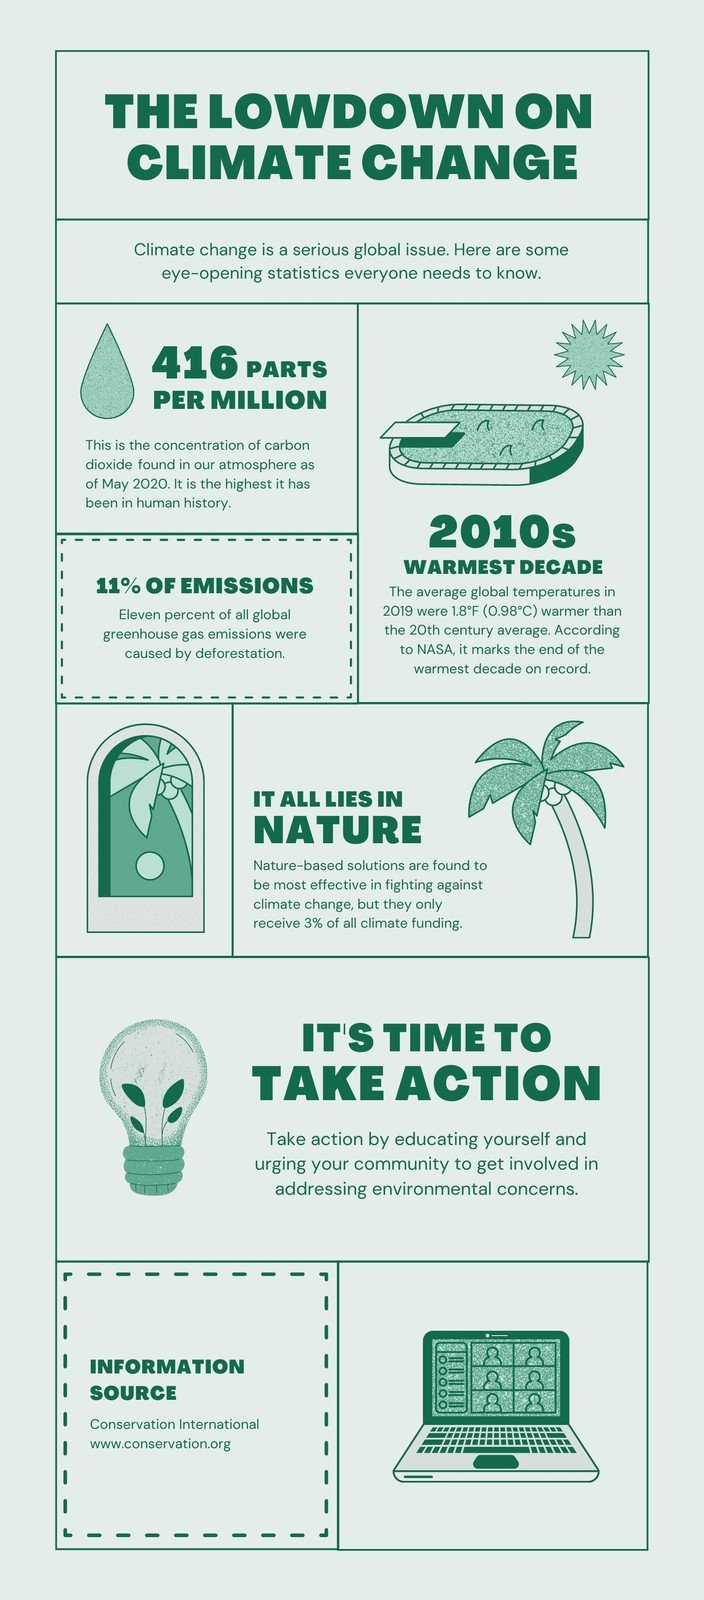
zilladop.weebly.com
Infographic technology timeline. Climate change infographic. Scientific infographic: how cool are they?

